Markov cluster process Model with Graph Clustering
The pervasiveness of graph in software applications and the inception of big data make graph clustering process indispensable. But still, extraction of clusters and their analysis need to be matured. Especially when the similarity between vertices are hidden and implicit within a graph. Existing technique influenced by the representation of the vertices.
Clustering is a “grouping of related items”. It is a commonly used unsupervised learning technique. Major applications of graph clustering include pattern recognition, image processing, image segmentation, segmentation of textured images, segmentation of range images, segmentation of the multispectral image, etc.
Download Calculations in Excel File
Expansion and Inflation Excel Files Calculations
Clustering could be vector or graph based.
What is vector clustering?
In vector clustering every item in the group has unique vector coordinates mapped on x and y-axis. Similarity and dissimilarity between vertices are usually done by Euclidian distance formula. Lower the distance, higher the similarity and vise versa.
Examples of vector-based graphs
Examples of vector-based graphs are the Minimum Spanning Tree, the Gabriel Graph and the Relative Neighborhood Graph.
What is Graph clustering?
Graph clustering is a collection of vertices and edges, where vertices are connected with each other by means of edges. In such a case, edges could have a weight or some time without any weight. Path, degree, cycle, connectedness, etc. are some parameters to assist in clustering extraction.
Clustering and its analysis are very much non-deterministic because of being are dependent on other factors. There is no common framework used in clustering so different framework employs different clustering. Same goes for cluster analysis which is very much influenced by one’s perception. It could vary from person to person.
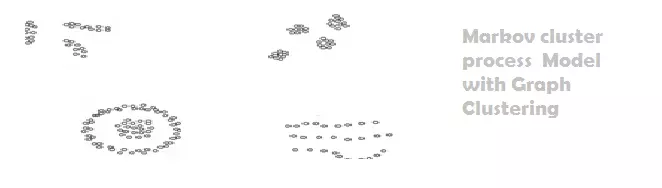
Furthermore, there could be different shapes of clusters cube-shaped, ring-shaped, diamond-shaped, etc. as shown in figure 1 and to determine which is of high priority and on what basis is again ground of research and debate.
Major problems during Clustering
- Clustering with the independence of representation is very difficult and when it comes to a simple graph or weighted graph with symmetric weights, the problem becomes even large.
- Finding clusters is big time challenging when similarity and dissimilarity are implicit within the graph
What is the Markov Chain and Random Walk?
In random walk, we start arbitrary from any edge and move from node to node through connected edges. Eventually, there would be a group if by random walk we mostly visit the nodes of the same group. This is what is called the Markov chain.
Markov cluster process Model
The Markov cluster process (MCL) is a process of evolving and alteration of stochastic matrices by applying two operations. Eventually, we come up with the optimal metrics which implies the cluster in a graph. The approach consists of a few steps which are briefly discussed below;
- Create the associated matrix
- Add self-loops to each node (optional)
- Normalize the matrix
- Expand by taking the nth power of the matrix
- Inflate by taking inflation of the resulting matrix with parameter r
- Repeat steps 5 and 6 until a steady state is reached (convergence).
- Interpret resulting matrix to discover clusters
Step 1: Creating the associated matrix
- The transition matrix is a two-dimensional matrix. In which columns/rows are labeled in correspondence with node. It is stochastic in nature, which means that the sum of all the rows in any column is exactly equal to 1. Figure 2 shows the probability matrix.
Step 2 and 3: Adding self looping and normalization
This is done by adding a dependency to the transition probabilities on the parity of the simple path lengths Transition probability. Furthermore, adding a small path of length 1, so the mass does not only appear during odd powers of the matrix.
After a few iteration Markov chain would be developed which is similar to figure 3 for the probabilistic graph.
Step 4: Inflation
Inflation is a rescaling of each of the columns of M with power coefficient.
Step 5: Inflation
Repeat step 3 and 4 eventually we come up with an optimized cluster.
The complexity of the algorithm
The time complexity of the algorithm is O(N3), where N is the number of vertices. Inflation can be done in O(N2) time
Critique of The Markov process:
The MCL works with both weighted and unweighted graphs.
It is robust against noise in graph data. But still, it possesses two limitations. First is that it is not good for too large graphs and second is that driving graphs in the vector model is not feasible.
Reference Research Papers for further Study
| [1] | Anil K. Jain and Richard C.Dubes, “Algorithms for Clustering Data,” , 1998, pp. 223-240. |
| [2] | Dongen Van and Marinus Stijn, “Graph clustering by flow simulation,” , 2001. |
| [3] | P. Sneath and R. Sokal, “Numerical Taxonomy,” , 1973. |
| [4] | N. Jardine and R. Sibson, “Mathematical Taxonomy,” in Wiley Series In Probabilistic And Mathematical Statistics, 1971. |
| [5] | M. Anderberg, “Cluster analysis for Applications,” , 1973. |
| [6] | R. Duda and P. Hart, “Pattern classification and scene analysis,” , 1973. |
| [7] | B. S. Everitt, “Cluster Analysis,” , 1993. |
| [8] | J. Hartigan, “Clustering Algorithms,” , 1975. |
| [9] | J. Van Ryzin, “Classification and Clustering. ,” in Proceedings of an Advanced Seminar Con-ducted by the Mathematics Research Center, The University of Wisconsin at Madison, New York, 1977, pp. 173–187. |
| [10] | L. Kaufman and P. J. Rousseeuw, “Finding Groups in Data,” , 1983. |
| [11] | A. K. Jain and R. C. Dubes, “Algorithms for Clustering Data,” , 1988. |
| [12] | D. L. Massart and L. Kaufman, “The Interpretation of Analytical Chemical Data by the Use of Cluster Analysis,” in Wiley Series in Probability and Mathematical Statistics, 1990. |
| [13] | B. Mirkin, “Mathematical Classification and Clustering,” , 1996. |
Next Similar Tutorials
- KMeans Clustering in data mining. – Click Here
- KMeans clustering on two attributes in data mining. – Click Here
- List of clustering algorithms in data mining. – Click Here
- Markov cluster process Model with Graph Clustering – Click Here.