Min Max is a data normalization technique like Z score, decimal scaling, and normalization with standard deviation. It helps to normalize the data. It will scale the data between 0 and 1. This normalization helps us to understand the data easily.
For example, if I say you to tell me the difference between 200 and 1000 then it’s a little bit confusing as compared to when I ask you to tell me the difference between 0.2 and 1.
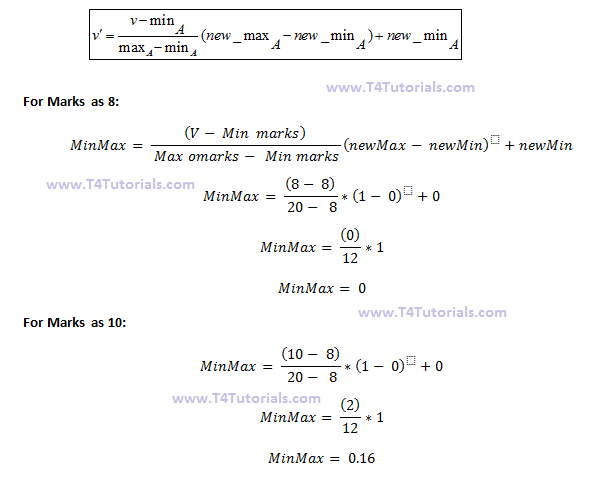
Min Max normalization formula
marks |
| 8 |
| 10 |
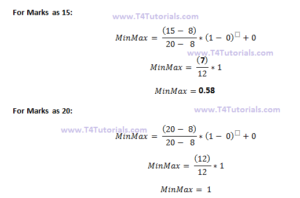
| 15 |
| 20 |
Min:
The minimum value of the given attribute. Here Min is 8
Max:
The maximum value of the given attribute. Here Max is 20
V: V is the respective value of the attribute. For example here V1=8, V2=10, V3=15, and V4=20
newMax:
1
newMin:
0
marks |
marks after Min-Max normalization |
| 8 | 0 |
| 10 | 0.16 |
| 15 | 0.58 |
| 20 | 1 |
Min max normalization example
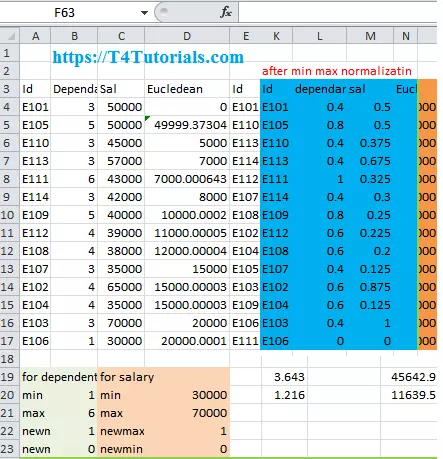
Download Excel File Calculations
 E
EExample #2
Normalize the following data;
| Rollno | programming | database | stats | data mining |
| 133 | 55 | 33 | 4 | 55 |
| 134 | 44 | 56 | 34 | 33 |
After Normalization:
| Rollno | Programming | Database | Stats | Data Mining |
| 133 | 0.6667 | 0 | 0 | 1 |
| 134 | 0 | 1 | 1 | 0 |
- Find the minimum and maximum values for each attribute:
- Programming: min = 44, max = 55
- Database: min = 33, max = 56
- Stats: min = 4, max = 34
- Data Mining: min = 33, max = 55
- Apply the min-max normalization formula for each value:
- For the first row, Rollno is not normalized, so we leave it as it is.
- For Programming in the first row: (55 – 44) / (55 – 44) = 0.6667
- For Database in the first row: (33 – 33) / (56 – 33) = 0.0000
- For Stats in the first row: (4 – 4) / (34 – 4) = 0.0000
- For Data Mining in the first row: (55 – 33) / (55 – 33) = 1.0000
- For the second row, we repeat the same process.
Comparison of Min-Max Normalization and Z-Score Normalization
Let’s see the comparison of Min-Max Normalization and Z-Score Normalization
| Min-max normalization | Z-score normalization |
| Not very well efficient in handling the outliers | Handles the outliers in a good way. |
| Min-max Guarantees that all the features will have the exact same scale. | Helpful in the normalization of the data but not with the exact same scale. |