By: Prof. Dr. Fazal Rehman | Last updated: December 26, 2023
Z-Score Normalization – (Data Mining)
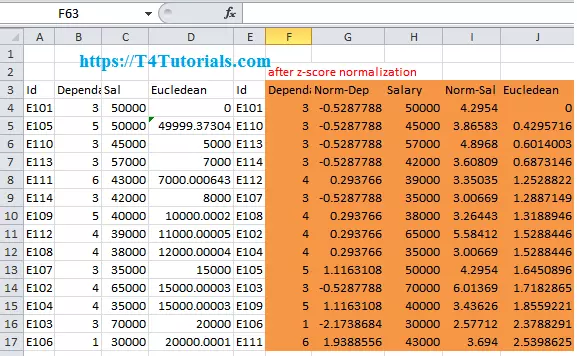
Z-Score helps in the normalization of data. If we normalize the data into a simpler form with the help of z score normalization, then it’s very easy to understand by our brains.
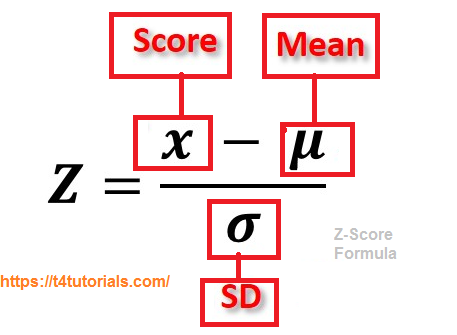
Z- Score Formula
How to calculate Z-Score of the following data?
marks
8
10
15
20
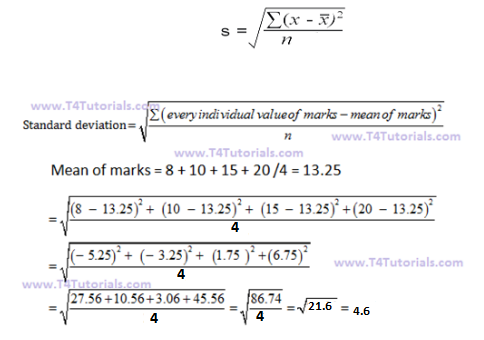
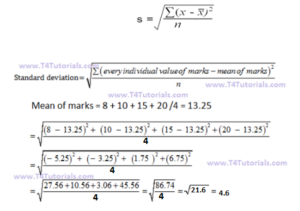
Figure: z score normalization standard deviationMean = 13.25
Standard deviation = 4.6
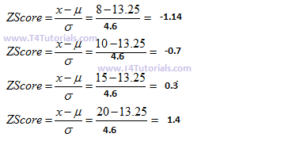
Figure: z score normalization data mining
marks
marks after z-score normalization
8
-1.14
10
-0.7
15
0.3
20
1.4
Download Excel File Calculations
Click HereFigure: Z Score normalization Excel File Calculations
How to calculate Z-Score of the following data?
How do you use a z score table?
1. We can find a specific area under the normal distribution curve.
2. We can find the z-score of the data value and use a Z-Score Table.
Z-Score Table is used to find the area.
A Z-Score Table shows the area percentage to the left of a given z-score on a standard normal distribution.
Advantages of the z score
The z-score is very useful when we are understanding the data. Some of the useful facts are mentioned below;
The z-score is a very useful statistic of the data due to the following facts;
It allows a data administrator to understand the probability of a score occurring within the normal distribution of the data.
The z-score enables a data administrator to compare two different scores that are from different normal distributions of the data.
Is a higher or lower Z score better?
Suppose we have data from two persons. Person A has a high Z score value and person B has a low Z Score value. In this case, the higher Z-score indicates that Person A is far away from person B.
What does a negative and a positive z score mean?
A negative z-score indicates that the data point is below the mean.
A positive z-score indicates that the data point is above the mean.
Why is the mean of Z scores is 0?
The standard deviation of the z-scores is always 1 and similarly, the mean of the z-scores is always 1.
Z-scores values above 0 represent that sample values are above the mean.
z-scores values below 0 represent that sample values are below the mean.
In the case of squared z-scores, the sum of the squared z-scores is always equal to the number of z-score values.
What is the meaning of the high Z score and low Z score?
Suppose we have a high Z-score value then it means a very low probability of data above this Z-score.
Suppose we have a low Z-score value then it means a very low probability of data below this Z-score.