finding the estimated mean, median and mode for grouped data in data mining
By: Prof. Dr. Fazal Rehman | Last updated: December 26, 2023
How to calculate the estimated mean and estimated median of grouped data?
In this tutorial, we will try to learn the followings;
Estimated mean
Estimated median
Estimated mode
Class intervals
Age
Mid of age
Frequency
Mid * Frequency
21 – 25
23
5
23 * 5 = 115
26 – 30
28
2
28 * 2 = 56
31 – 35
33
6
33 * 6 = 198
35 – 40
37
8
37 * 8 = 296
Total
21
665
Estimated Mean = 665 / 21
= 31.66
Class intervals:
Group 21 to 25, 26 to 30, 31 to 35 and 35 to 40 are class intervals.
Mean is 31.6 so 31.6 rounds to 32.
Estimated mean = 32
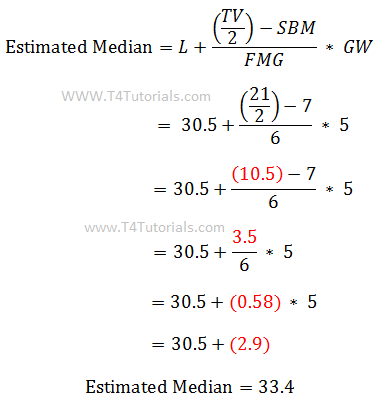
Median group = 31 to 35Estimated Median = ?
Estimated Median = L + (TV / 2) – SBM ⁄ FMG * GW
L = Lower boundary of median group
30.5
TV = Total number of values
21
SBM = Sum of frequencies before median group
7
FMG = Frequency of median group
6
GW = Group width
5
Result: Our median group is 31 to 35 and yes estimated median 33.4 is in the median group.
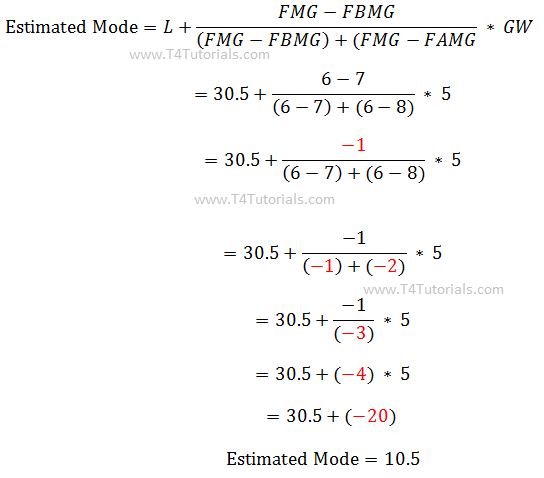
How to calculate the estimated mode of the above-grouped data?
L = Lower boundary of the median group
30.5
SBM = sum of frequencies before the median group
7
FMG = Frequency of median group
6
FBMG = Sum of frequencies of all groups before the median group
7
FBMG = Sum of frequencies of all groups after median group
8
GW = Group width
5
Mode: Mode is the most occurring Value in the data.
 Result: Our median group is 31 to 35 and yes estimated median 33.4 is in the median group.
How to calculate the estimated mode of the above-grouped data?
Result: Our median group is 31 to 35 and yes estimated median 33.4 is in the median group.
How to calculate the estimated mode of the above-grouped data?