By: Prof. Dr. Fazal Rehman | Last updated: May 8, 2024
Min Max is a data normalization technique like Z score, decimal scaling, and normalization with standard deviation. It helps to normalize the data. It will scale the data between 0 and 1. This normalization helps us to understand the data easily.
For example, if I say you to tell me the difference between 200 and 1000 then it’s a little bit confusing as compared to when I ask you to tell me the difference between 0.2 and 1.
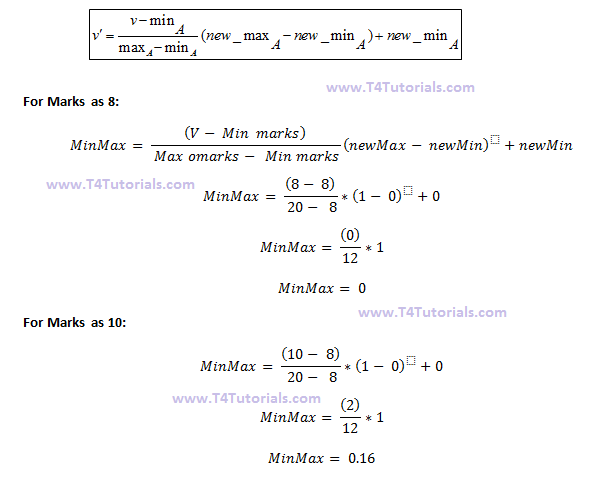
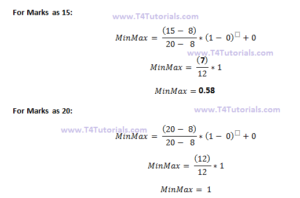
Min Max normalization formula
marks
8
10
15
20
Min:
The minimum value of the given attribute. Here Min is 8Max:
The maximum value of the given attribute. Here Max is 20V: V is the respective value of the attribute. For example here V1=8, V2=10, V3=15, and V4=20
newMax:
1
newMin:
0
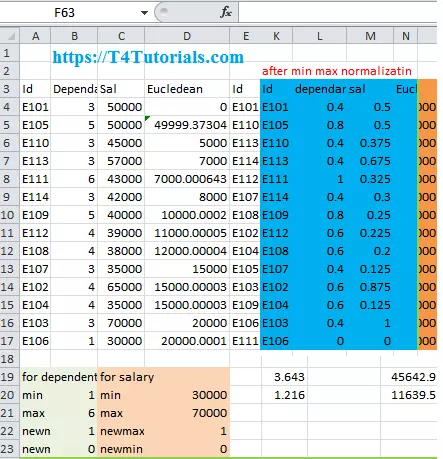
Figure: min-max normalization scaling

 E
E