Forward and Backward pass in Network Diagram is a very important topic of Software Project Management. In most of the examinations, it is asked by the teachers. So let’s discuss the topic.
What is the critical path?
A critical path is a path with the least amount of slack/float time.
What is a float/slack time?
Float/Slack time is the time that an activity can be delayed without delaying the project.
When we complete the project through a critical path, then it is the longest path as compared to other paths. If any activity is late in the critical path, then it delays all the projects. So we need to take care of a critical path.
Early Finish = Early Start + Duration
Late Start = Late Finish – Duration
Float/Slack Time = Late Start – Early Start
| Activity | Predecessor | Duration |
| A | – | 3 |
| B | A | 4 |
| C | A | 2 |
| D | B | 5 |
| E | C | 1 |
| F | C | 2 |
| G | D,E | 4 |
| H | F,G | 3 |
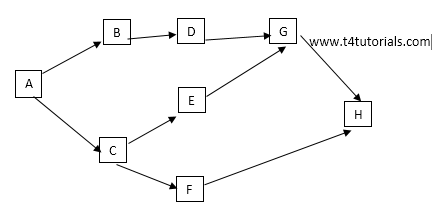
We can draw the network diagram by keeping in the

In the above figure, A is predecessor of B and C, B is predecessor of D, D is predecessor of G, C is predecessor of E and F, F is predecessor of H, E is predecessor of G and so on.
| Early Start | Duration of activity/task | Early Finish |
| Activity/Task | ||
| Late Start | Duration of activity/task | Late Finish |
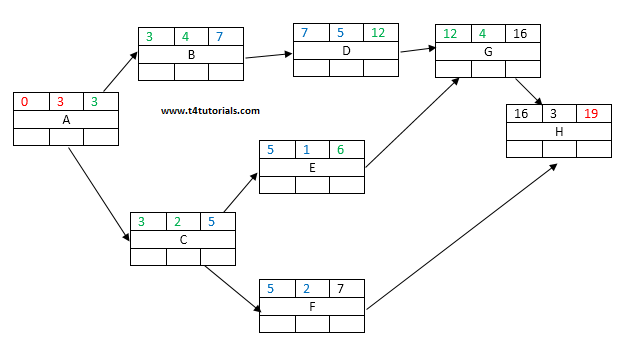
In activity A, 0 is the early start time, 3 is the Duration of the activity, and 3 is the Early finish time.
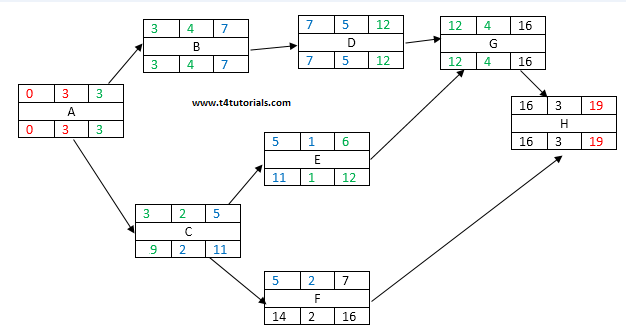
In activity F, 14 in the Late Start time, 2 is the Duration of activity/task, and 16 is the Late Finish time and so on for each activity is mentioned in the above figure.
Advantages of network diagram
There are many advantages of making the network diagram. Some of the advantages are mentioned below;
- To identify the potential risks of the given project
- Documentation for external communication
- To record and track the progress of the project
- For Planning the overall structure of the given project
- For Coordinating with updates
- For the time estimation of the given project
- To ease the planning of the given project
- To ease the organising of the given project
- To ease the controlling of the given project
- To sell the project proposal to financial stakeholders of the given project
- When proposing changes to stakeholders
- To identify the opportunities
- To show the progress of the activities according to the Software requirement specification.
- To identify the dependencies of the activities
- To elaborate the project workflow
Frequently Asked Question (FAQ)
What is a network diagram used for?
Network Diagrams are a graphical representation of the activities of a given project. In Network Diagram we try to show that how each activity relates with other activities in the given project. Network Diagram represents the sequence of activities.
Why are activities drawn in a serial relationship in a network diagram?
Sequence of activities is very important in network diagram because sequence represent that how much important is the initial activity for some other activity to perform a task.
What is dummy activity in network diagram?
A Dummy activity is an activity which does not require a time or resource. A Dummy activity is an imaginary activity. We show the dummy in a network diagram to identify the dependence among other operations in the diagram.
Best network diagram software
- Draw.io (FREE)
- Microsoft Visio (PAID)
- SmartDraw (PAID)
- LucidChart (PAID+FREE)
- ConceptDraw (PAID)
- Creately (PAID+FREE)
- Visual Paradigm (PAID)
- Edraw (PAID)
- Dia Diagram Editor (FREE)
- SolarWinds Network Topology Mapper (PAID)
- Intermapper (PAID)
- Network Notepad (FREE + PAID)
- LanTopoLog (FREE)