By: Prof. Dr. Fazal Rehman | Last updated: March 3, 2022
ROC and Area Under Curve in Data Mining
“ROC and Area Under Curve in Data Mining” is the topic of discussion in this tutorial. Let’s begin.
What is ROC Curve?
ROC Curve is a tool helpful when predicting the probability of a binary outcome is the ROC curve. ROC stands for Receiver Operating Characteristic curve.
It can be the plot to compare the false positive rate on the x-axis versus the true positive rate on the y-axis.
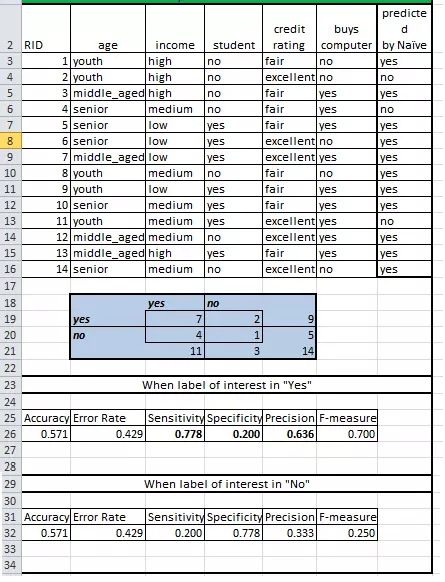
Figure: Accuracy for “NO” as a positive
Download the Microsoft Excel Calculations in Excel File Click Here
How to calculate the True Positive Rate?
True Positive Rate can be calculated by the following formulae;
True Positive Rate = True Positives / (True Positives + False Negatives)
How to calculate Sensitivity?
How to calculate the sensitivity?
Sensitivity can be calculated by the following formulae;
Sensitivity = True Positives / (True Positives + False Negatives)
How to calculate the False Positive Rate?
False Positive Rate can be calculated by the following formulae;
False Positive Rate = False Positives / (False Positives + True Negatives)
How to calculate Specificity?
Specificity can be calculated by the following formulae;
Specificity = True Negatives / (True Negatives + False Positives) where False Positive Rate = 1 – Specificity