Worst-Case boundary value analysis is a Black Box software testing technique.
In Worst case boundary value testing, we make all combinations of each value of one variable with each value of another variable.
Worst Boundary value testing on 2 variables

Video Lecture
Suppose we have two variables x1 and x2 to test.
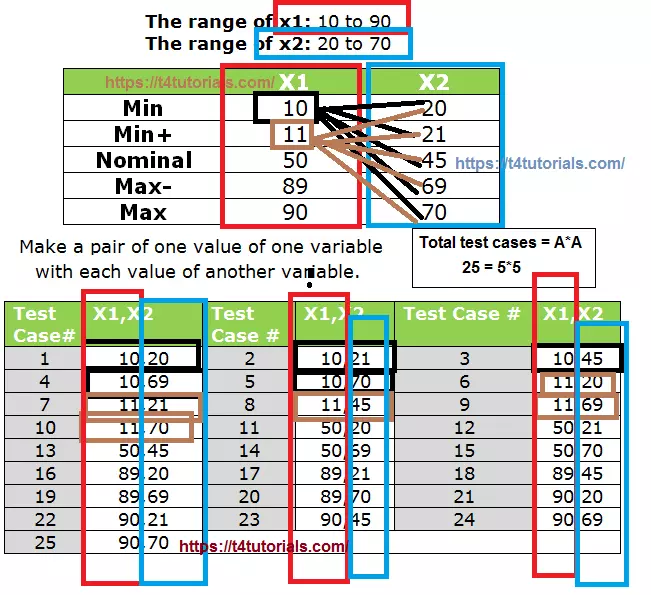
The range of x1: 10 to 90
The range of x2: 20 to 70
| X1 | X2 | |
| Min | 10 | 20 |
| Min+ | 11 | 21 |
| Nominal | 50 | 45 |
| Max- | 89 | 69 |
| Max | 90 | 70 |
Figure: Testing points detected in Worst Case Boundary Value Testing.
Test cases:
Total test cases = A*A
25 = 5*5
A= Number of testing points.
These testing points are min, min+, nominal, max- and max.
We can generate 25 test cases from both variables x1 and x2 by making a combination of each value of one variable with each value of another variable.
| Test Case# | X1,X2 | Test Case # | X1,X2 | Test Case # | X1,X2 |
| 1 | 10,20 | 2 | 10,21 | 3 | 10,45 |
| 4 | 10,69 | 5 | 10,70 | 6 | 11,20 |
| 7 | 11,21 | 8 | 11,45 | 9 | 11,69 |
| 10 | 11,70 | 11 | 50,20 | 12 | 50,21 |
| 13 | 50,45 | 14 | 50,69 | 15 | 50,70 |
| 16 | 89,20 | 17 | 89,21 | 18 | 89,45 |
| 19 | 89,69 | 20 | 89,70 | 21 | 90,20 |
| 22 | 90,21 | 23 | 90,45 | 24 | 90,69 |
| 25 | 90,70 | ||||
Figure: Test cases generated in Worst Case Boundary Value Testing
These 25 test cases are enough test cases to test the input values for these variables.