Note: Please understand the tutorial of quartile before moving to this topic.
What is box plot and how to draw the box plot for even and odd length data set?
- Box plot is a plotting of data in such a way that it is like a box shape and it represents the five number summary. Five summary is a minimum value, Quartile 1, Median, Quartile 3 and maximum value.
- End of the box is represented by inter-quartile range (IQR).
- IQR = Q3 – Q1
- The median is marked by a line within the box
- A rectangle is drawn to represent the second and third quartiles, usually with a vertical line inside to indicate the median value. The lower and upper quartiles are shown as horizontal lines either side of the rectangle. Maximum and minimum values are on the whiskers. Whiskers are the lines drawn on maximum and minimum value.
[quads id=2]
Draw the box plot for the odd length data set?
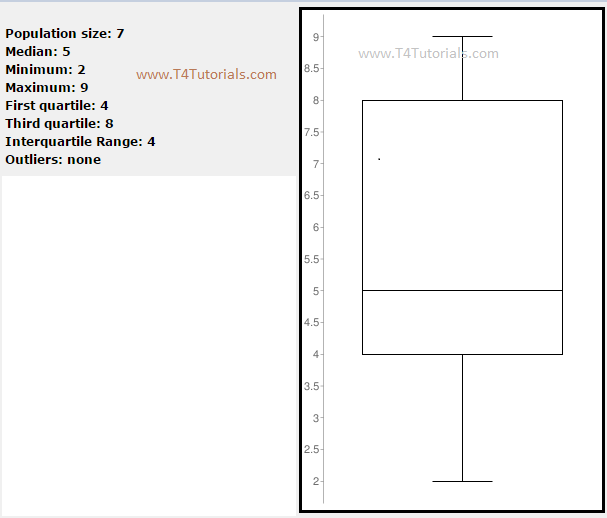
| Data = 2, 4, 5, 5, 8, 8, 9
First of all, find the quartiles. Q1: 4 – Lower quartile Q2: 5 – Middle quartile Q3: 8 – Upper quartile Inter Quartile Range= Q3 – Q1 = 8 – 4 = 4 Population size: Population size is the total number of values in data. |
Box Plot:

Draw the box plot for the even length data set?
| Data = 8, 5, 2, 4, 8, 9, 5,7 |
First of all arrange the values in sequence.
| 2, 4, ♦ 5, 5, ♦ 7, 8 ♦ 8, 9
Minimum: 2 Q1: 4 + 5 / 2 = 4.5 – Lower quartile Q2: 5+ 7 / 2 = 6 – Middle quartile Q3: 8 + 8 / 2 = 8 – Upper quartile Maximum: 9 |
Box Plot:

Next Tutorials with Similar Topics
- Type of Data that can be mined – Click Here
- Attributes Types – Click Here
- Mean, Median, Mode – Click Here
- Estimated Mean, Median, Mode – Click Here
- Data Quartiles – Click Here
- Box Plot for Data – Click Here
-
Variance and standard deviation of data in data mining – Click Here Calculator – Click Here
- Data skewness – Click Here
- Correlation analysis of numerical data in Data Mining – Click Here
- Correlation analysis of Nominal data with Chi-Square Test in Data Mining – Click Here
- Data discretization and its techniques in data mining – Click Here


